![]()
![]()
![]()
|
|
|
|
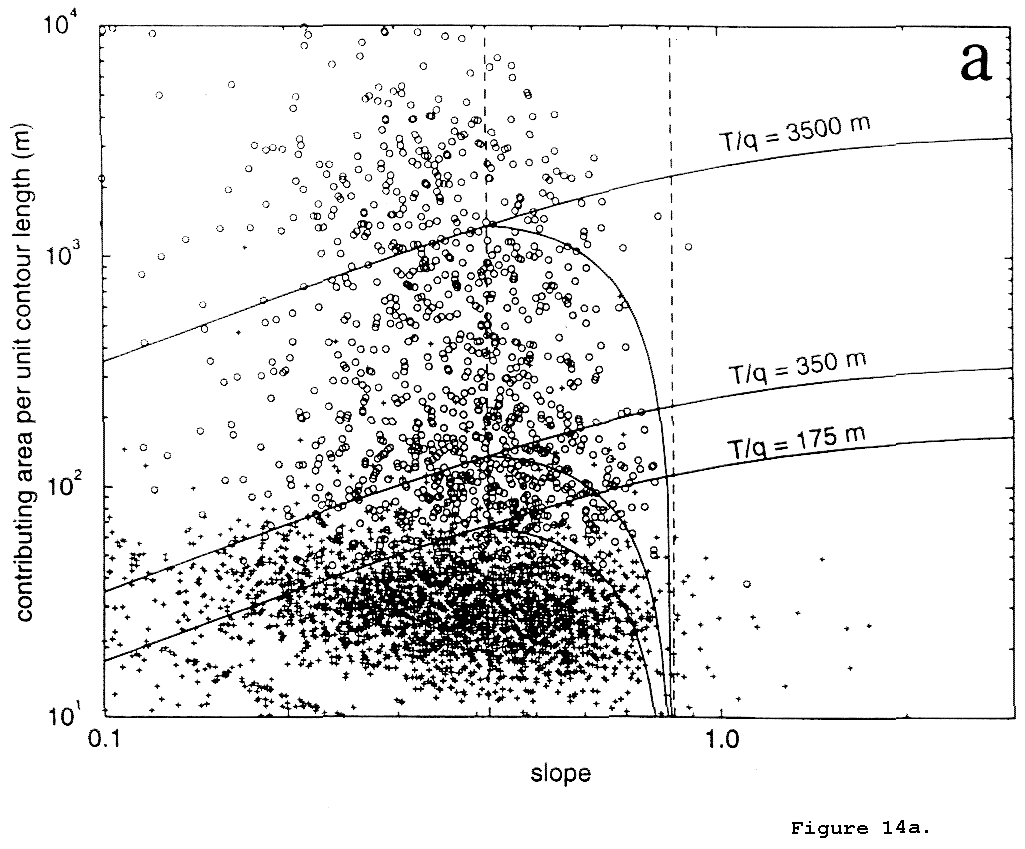
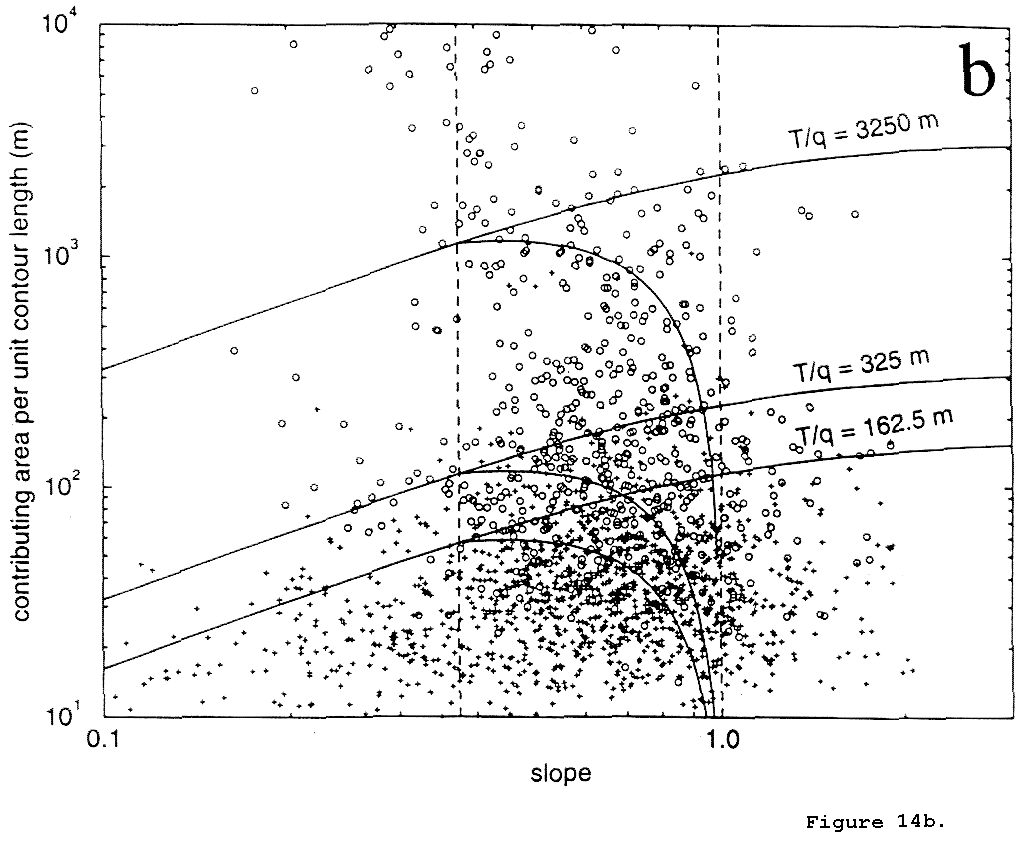
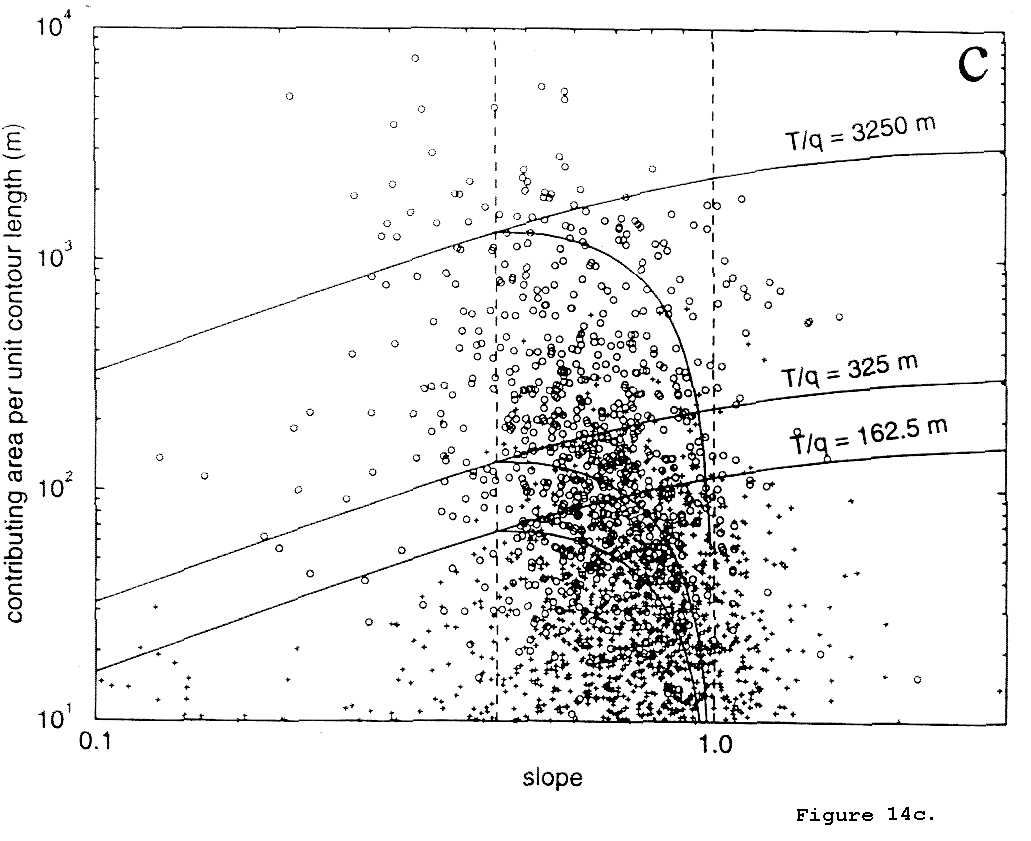
Figure 14. Plots of contributing area per unit contour length (a/b) versus slope (tan q) for convergent (circles) and divergent (crosses) elements in (a) Tennessee Valley, California (see Dietrich et al., 1992, 1993); Mettman Ridge (based on 5 m contour data derived from aerial photography before clear cutting began), and Split Creek (based on 5 m contour data derived from aerial photography). The T/q values on the saturation threshold solid lines correspond to log (q/T) values of -3.5, -2.5 and -2.2 from top to bottom in each graph. Dashed lines represent limit to slope stability model(from Montgomery and Dietrich, 1994).
|
|
Copyright 1998, William Dietrich and David Montgomery
|